 |
||
How much of the DNA sample is actual woolly mammoth sequence? Sequences extracted from an old sample are bound to include DNA from bacteria and other micro-organisms that have contaminated the sample. Moreover, there is the possibility that the handling of the sample when it was recovered or processed has introduced further contamination. Thus, we needed to determine which of the DNA reads are from the mammoth genome. We were fortunate in two respects. First, woolly mammoths were relatively similar to existing species of elephants from Africa and Asia. Second, a fairly exhaustive collection of DNA sequences from the African savanna elephant were already available. These two facts let us accurately determine which pieces of DNA are from the mammoth genome, as opposed to, for example, coming from a bacterium that lived on the mammoth's remains or from a human that handled the specimen. As it turns out, on average over 99% of the bases in a piece of mammoth DNA sequence are identical to those in the corresponding part of the elephant genome. It was sufficient to compare each mammoth fragment (they averaged around 120 bases long) with all of the available elephant sequences, and look for a match of around 99% identity. For modern computers, this is an easy task. We determined that about 80% of our sequence is from the mammoth genome. We compared the remaining 20% of the sequences with all of the other known DNA sequences and identified some of the microbial species that had infiltrated the sample, and perhaps even infected the animal when it was alive, long ago. The following two pie charts show the composition of the data that we obtained from the two Siberian mammoth specimens that we sequenced extensively, called M4 and M25. |
||
 |
||
Figure
1 |
||
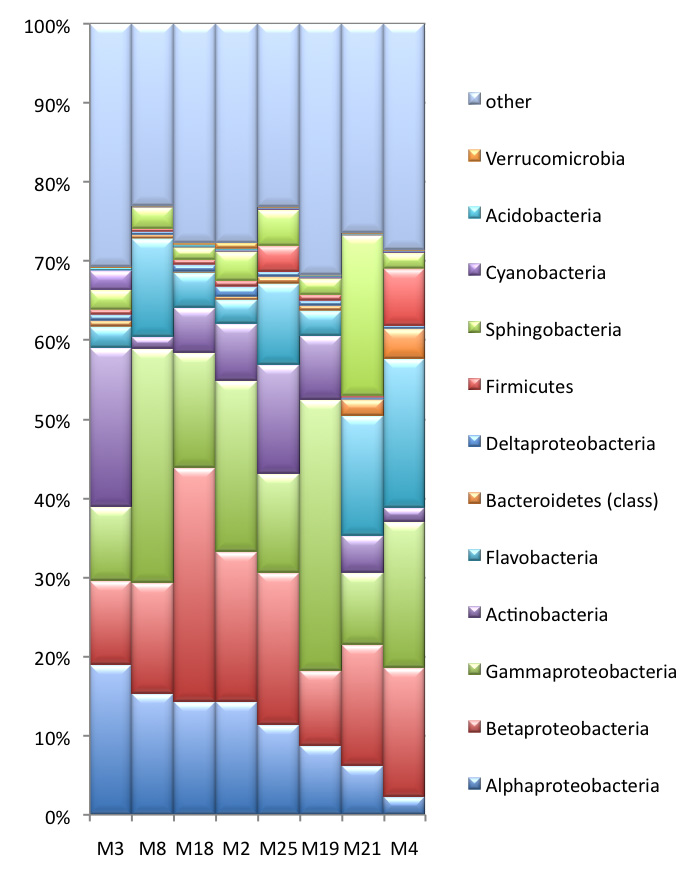
Metagenome
analysis and the mammoth biome
In the mammoth genome sequencing project, we also obtained >1Gb of metagenomic sequences derived from environmental organisms (e.g. bacteria, fungi, viruses, etc.). While these sequences are considered contamination by most ancient DNA laboratories, we spend a great effort to analyze them further, as at least some of the sequences might harbor information from organisms that actually lived on the mammoth when it was alive. For this undertaking, we conduct metagenomics analysis which classifies the taxonomic groups in the sample. The taxonomic composition of bacterial cohorts can vary among different mammoth samples (left figure), which may to some extent reflect the divergence in community structure among various sample collection sites. To investigate the sequence divergence between the metagenomic data and the known sequences in GenBank, we run a BLASTX analysis against the NR database. The resulting similarity distribution is shown in the figure below. Together with our collaborator Daniel Huson we are currently exploring the mammoth biome in a large number of samples. The comparative metagenome analysis is carried out with the software MEGAN. The development of MEGAN was initiated during the first stage of the mammoth project. |
||
|
||
Figure
2 |
||
 |